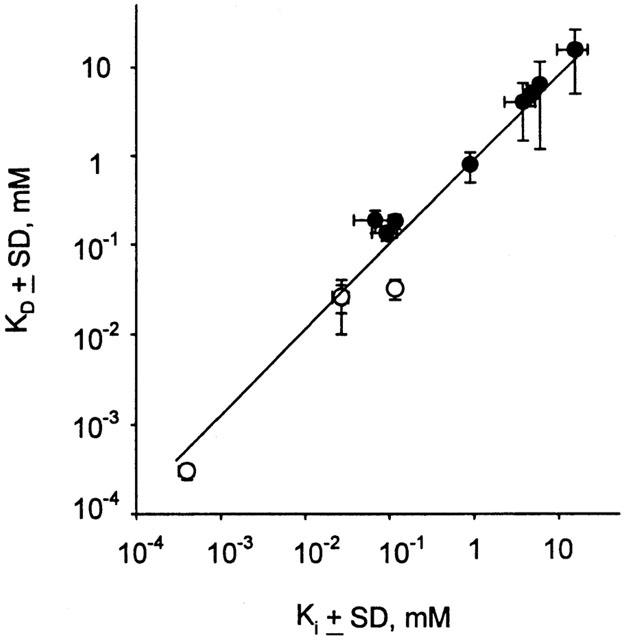
Figure 7.

Correlation of KD and Ki. The mean of each data set from Table 1 is plotted as Ki vs KD on a log/log scale. The line is fit to a linear regression, with slope=0.95 and regression coefficient r2=0.98. Open symbols are for KD determined from ΔQmax data, and closed symbols are from ΔV0.5 measurements; the Ki is always derived from inhibition of substrate-dependent current.
