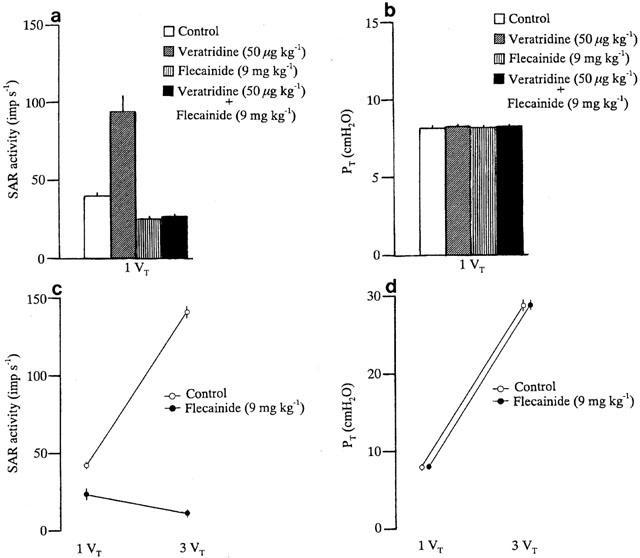
Figure 2.

Responses in SAR activity (a) and PT (b) to veratridine at control inflation (inflation volume=1 VT). Changes in SAR activity (c) and PT (d) in response to control inflation and hyperinflation (inflation volume=3 VT) before and after pretreatment with flecainide (9 mg kg−1). Values are the means for 18 animals and the vertical bars show the s.e.means.
