
Figure 1.
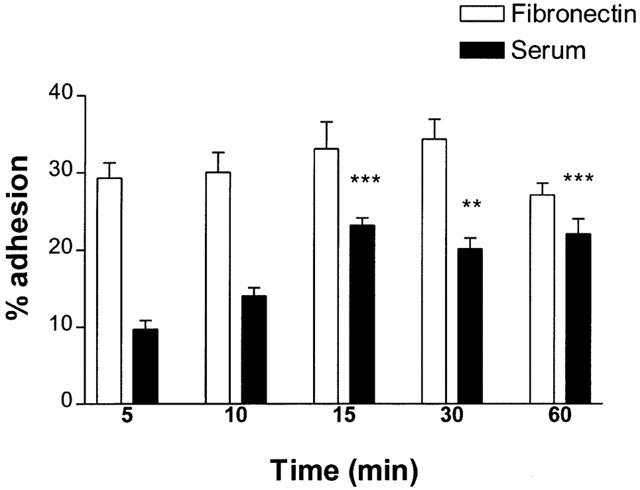
Time course of eosinophil adhesion to fibronectin (20 μg ml−1) and serum (10%, v v-1)-coated 96 well plates. 3.5×10⁴ cells were added to wells and incubated at 37°C, 5% CO2. Following incubation, non-adhered cells were removed and percentage cell adhesion was calculated by comparing eosinophil peroxidase activity of adherent cells to that of a standard curve. Results are expressed as mean adhered cell percentages of total cell number±s.e. of three independent experiments with three replicates in each. **P<0.01, ***P<0.001 compared to adhesion at 5 min.