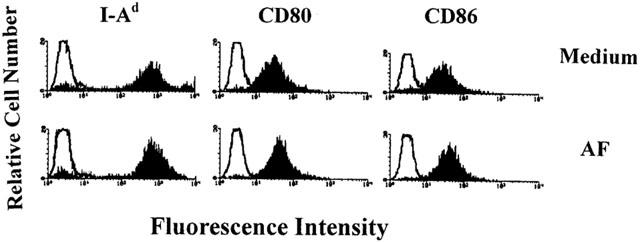
Figure 4.

Cytofluorometric analysis of cell surface molecules on AF-treated macrophages. Mouse macrophages were treated for 24 h with medium alone or 1.0 μg ml−1 AF and analysed for the expression of cell surface molecules by flow cytometry. Data are representative of three independent experiments.
