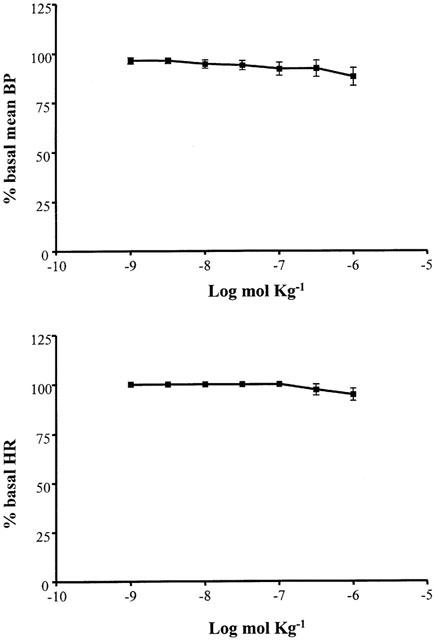
Figure 6.

Cardiovascular responses to IB-MECA (10−9 – 10−6 mol kg−1 i.v.) in anaesthetized guinea-pig in the absence of pretreatment. Each point in the curves is the mean·±s.e. of 4 – 6 experiments; *P⩽0.05. Values are reported as per cent of resting mean blood pressure (BP) or heart rate (HR) just prior to starting the agonist dose-response curve: 47.7±4.5 mmHg and 338.8±27.0 beats min−1.
