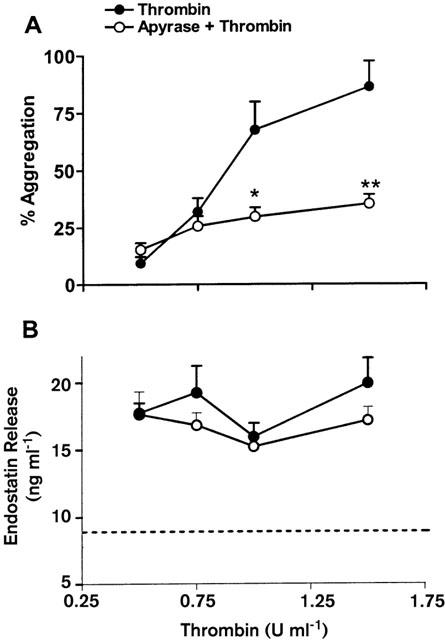
Figure 2.

Effects of apyrase (5 u ml−1) on thrombin-induced platelet aggregation (A) and endostatin release (B). The dotted line shows the basal level of endostatin in platelet rich plasma not exposed to an agonist. *P<0.05, **P<0.01 vs corresponding thrombin alone group.
