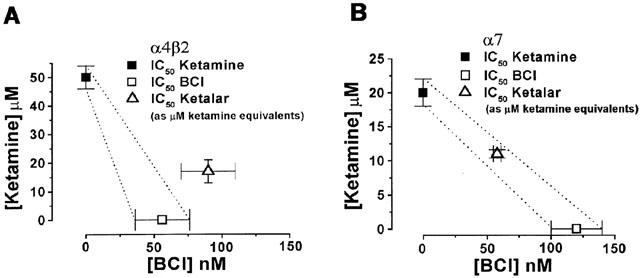
Figure 6.

A graphical analysis of ketamine and benzethonium chloride's interactions as seen in the α4β2 and α7 nAChRs. (A) Using 1 mM ACh as the agonist, the IC50 concentrations of ketamine alone, BCl alone and the combined drugs for inhibition of the α4β2 nAChR are plotted. The 95% confidence intervals for additivity are displayed as dotted lines. A subadditive effect between ketamine and BCl for the α4β2 subtype is shown. (B) Using 1 mM ACh as the agonist, the IC50 concentrations of ketamine alone, BCl alone and the combined drugs for inhibition of the α7 nAChR are plotted. The 95% confidence intervals for additivity are displayed as dotted lines. The IC50 concentrations for the combined drugs fall within the 95% confidence intervals, suggesting additivity. Error bars represent standard error.
