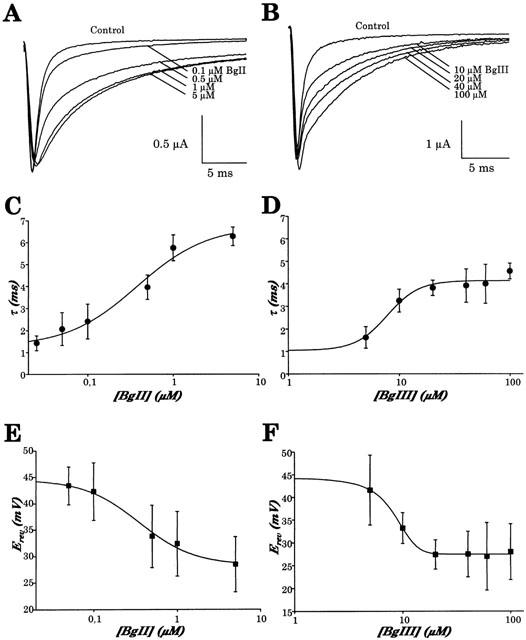
Figure 6.

Concentration dependence of the slowing of inactivation and of the modification of the reversal potential induced by BgII and BgIII toxins on hH1 Na+ channels. (A) Current traces were evoked by a step depolarization to 0 mV lasting 25 ms from a holding potential of −90 mV, in the absence (control) and in the presence of increasing concentrations of BgII toxin (as indicated), using the same oocyte. (B) Same protocol as in (A) but in the absence (control) and in the presence of increasing concentrations of BgIII toxin (as indicated), in the same oocyte. (C) Averaged time constant of inactivation (τ) plotted vs concentration of BgII toxin. Time constants of inactivation were calculated from a first order exponential fit of current traces evoked by a step depolarization to 0 mV from a holding potential of −90 mV. The EC50 value determined by a sigmoidal fit is 382±140 nM. Data are the mean±s.e.mean of at least three experiments. (D) Averaged time constant inactivation (τ) plotted vs concentration of BgIII toxin. Time constants of inactivation were calculated as in (C). The EC50 value as determined by a sigmoidal fit of τ is 7.8±1.2 μM. (E) Averaged reversal potential plotted vs concentration of BgII toxin. The EC50 value determined by a sigmoidal fit is 340±70 nM. (F) Averaged reversal potential plotted vs concentration of BgIII toxin. The EC50 value determined by a sigmoidal fit is 8.4±0.3 μM. Data are the mean±s.e.mean of at least three experiments at each concentration.
