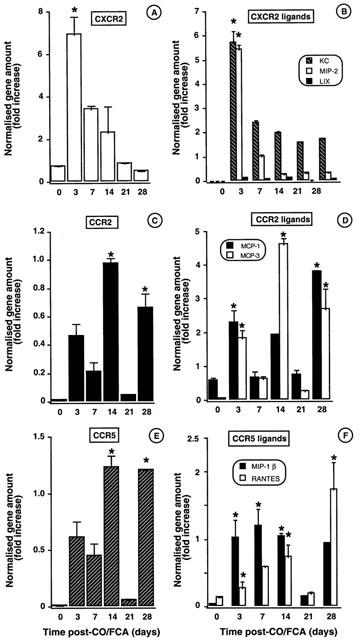
Figure 5.

Time-course of mRNA chemokine and chemokine receptor expression during CO/CFA inflammation as determined by TaqMan® RT – PCR analysis. Quantification of the following mRNA was made in granulomatous tissue samples. (A) CXCR2 and (B) CXCR2 ligands; KC, MIP-2 and LIX. (C) CCR2 and (D) CCR2 ligands; MCP-1 and MCP-3; (E) CCR5 and (F) CCR5 ligands; MIP-1β and RANTES. Values are fold increase of gene amount normalised against the 18S gene and expressed as mean±s.e.mean of >10 mice per group. *P<0.05 vs control (non inflamed) skin.
