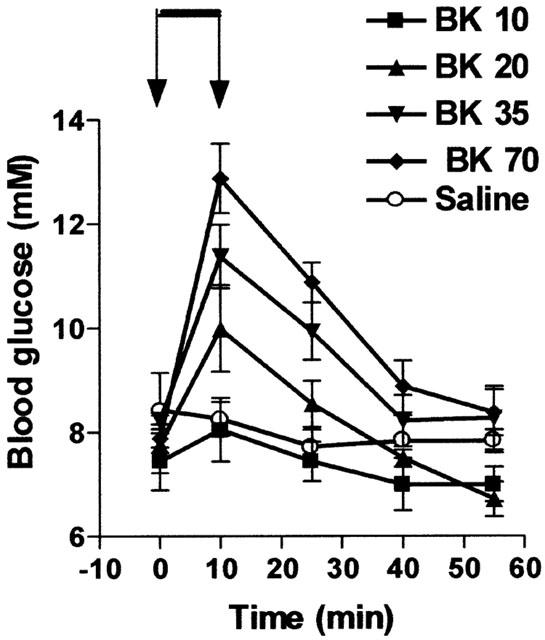
Figure 1.

Influence of BK on blood glucose levels. BK was infused for 10 min from time 0 – 10 (indicated by the arrows) at four different doses (10, 20, 35 or 70 nmol kg−1 min−1). Results show the changes in blood glucose levels as a function of time: mean±s.e.mean of six values for each point.
