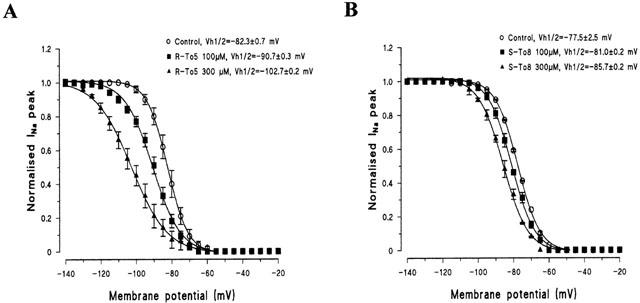
Figure 6.

Steady-state inactivation curves (h∞ curves) constructed with a prepulse duration of 1000 ms and the effect of increasing concentration of R-To5 (A) and S-To8 (B). At each membrane potential is shown the current amplitude normalized to the INa,max value obtained at −140 mV. Because certain variability exists between controls, the effect of each drug has been compared to the control h∞ curves recorded in the same experiments. Each point is the mean±s.e.mean of 3 – 6 experiments. Curves were fitted by a single Boltzmann distribution as described in Methods that allowed to calculate the Vh1/2, value of membrane potential at which 50% of channels are inactivated.
