
Figure 7.
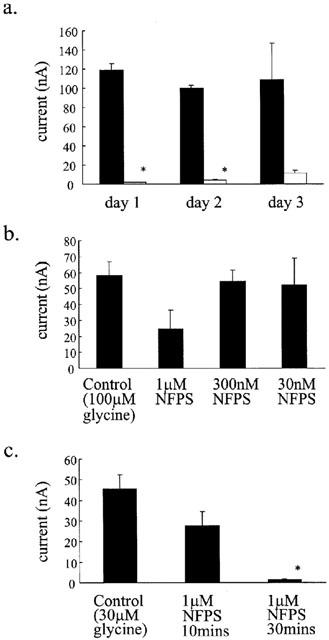
NFPS interacts with the oocyte membrane. (a) Oocytes expressing GLYT1b were exposed to 1 μM NFPS for 10 min and then washed at least three times daily for the next 3 days. Glycine transport currents were measured from oocytes 1, 2 and 3 days after NFPS exposure and compared to unexposed oocytes (Student's t-test). Currents were significantly inhibited on days 1 and 2, however on day 3, variability was high and although reduced this decrease did not reach significance. Data represents mean±s.e.mean, n⩾3 for each condition. (b) Immediately after injection of GLYT1b cRNA, NFPS was applied to the oocytes at the indicated doses for 10 min followed by extensive washing in standard buffer. Glycine transport currents were measured 3 days later and compared to unexposed oocytes. Data is mean±s.e.mean, n=3 for each condition. (c) A similar protocol to Figure 7b was used, except that 1 μM NFPS was applied for 10 min and 30 min immediately after cRNA injection. Data presented are from mean±s.e.mean, n=10 for each condition. Control experiments were also included where GLYT2a cRNA was injected instead of GLYT1b and in each case NFPS had no effect on the glycine transport currents. Data analysis for b and c was carried out using the Kruskal-Wallis test and Dunns test. Significance (P⩽0.05) is indicated by *.