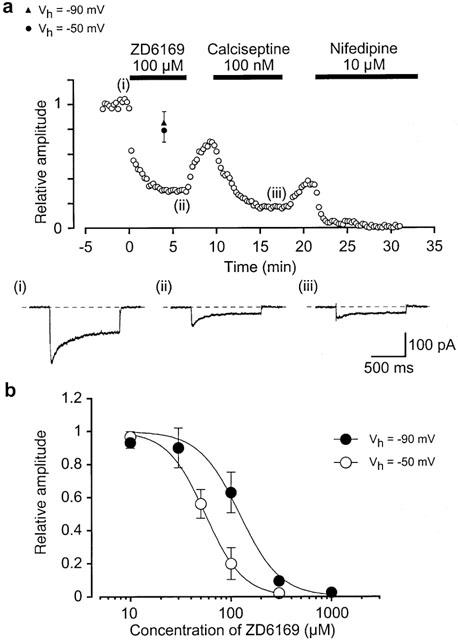
Effects of 100 μ
M ZD6169, 100 n
M calciseptine and 10 μ
M nifedipine on voltage-dependent Ba
2+ currents in pig urethra. Whole-cell recording, pipette solution Cs
+ – TEA
+ solution containing 5 m
M EGTA and the bath solution 10 m
M Ba
2+ containing 135 m
M TEA
+. (a) The time course of the effects of application of the three antagonists on the relative amplitude of the voltage-dependent Ba
2+ current evoked by repetitive depolarizing pulses to +10 mV from a holding potential of −50 mV. The peak amplitude of the voltage-dependent Ba
2+ current just before application of ZD6169 was normalized as one (control). The inset below shows individual traces as indicated by the numbers in the graph. On some occasions no pulses were applied for the initial four min after application of 100 μ
M ZD6169. The solid symbols show the size of the mean value of the peak amplitude of the voltage-dependent Ba
2+ current evoked by the first depolarizing pulse after this four min from two holding potentials (−50 mV, 0.79±0.09,
n=6; −90 mV, 0.85±0.09,
n=4). Time 0 indicates the time when 100 μ
M ZD6169 was applied to the bath. (b) Relationships between relative inhibition of the peak amplitude of Ba
2+ current and the concentration of ZD6169 at two holding potentials (−50 mV and −90 mV). The peak amplitude of the Ba
2+ current elicited by a step pulse to +10 mV from the holding potential just before application of ZD6169 was normalized as one. The curves were drawn by fitting the following equation using the least-squares method:
where
Ki, D and n
H are the inhibitory dissociation constant, concentration of ZD6169 (μ
M) and Hill's coefficient, respectively. The following values were used for the curve fitting: −50 mV,
Ki=55 μ
M, n
H=2.3; −90 mV
Ki=122 μ
M, n
H=2.2. Each symbol indicates the mean of 4 – 6 observation with±s.d. shown by vertical lines. Some of the s.d. bars are less than the size of the symbol.

