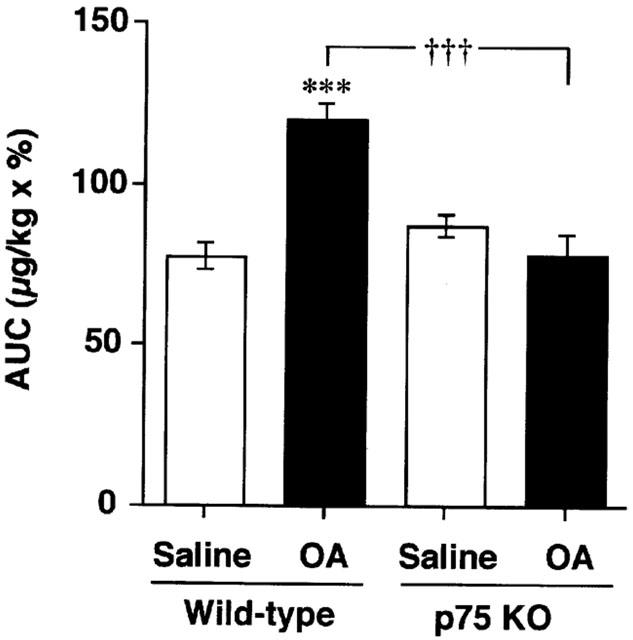
Figure 1.

Airway responsiveness to acetylcholine (Ach) after repeated antigen provocation in BALB/c (wild-type: WT) or p75N knockout (KO) mice. Values represent the means±s.e.mean of 5 – 7 animals. The number of animals in each group was as follows: saline treated wild-type mice (5); OA treated wild-type mice (6) and others (7). AUC: area under the curve (range 31.25 – 2,000 μg kg−1 acetylcholine). OA: ovalbumin. ***P<0.001 (vs saline: Student's t-test). †††P<0.001 (vs wild-type: Student's t-test).
