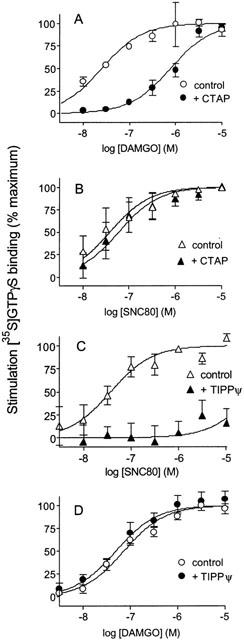
Figure 2.

Effect of mu-(CTAP) and delta- (TIPPψ) selective antagonists on DAMGO and SNC80 concentration-response curves. Concentration-response curves for [35S]-GTPγS binding were determined for DAMGO and SNC80 in the absence and presence of antagonist, and expressed as % maximal stimulation. (A) 300 nM CTAP produces a 1.68±0.14 log rightward shift in the DAMGO concentration-response curve. (B) 300 nM CTAP has no significant effect (0.19±0.15 log rightward shift) on the SNC80 concentration-response curve. (C) 10 μM TIPP[ψ] blocks G protein stimulation by SNC80 at concentrations up to 10 μM. (D) 10 μM TIPP[ψ] has no significant effect (0.14±0.25 log leftward shift) on the DAMGO concentration-response curve. Shown are means±s.e.mean from at least three independent experiments carried out in duplicate.
