
Figure 3.
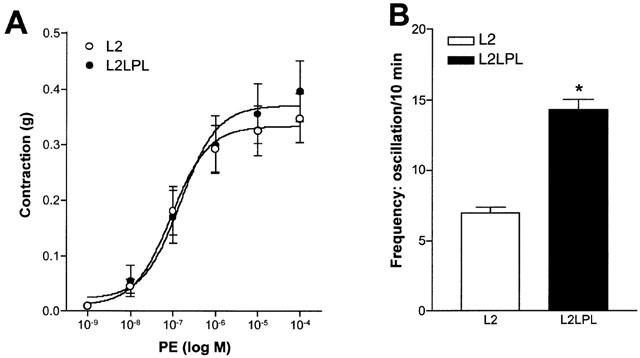
Effect of the α1 receptor agonist phenylephrine (PE) on blood vessel tone of aortae that were freshly isolated from L2 and L2LPL mice. (A) Cumulative concentration response curve for PE was commenced. If oscillatory tone occurred, the mean tension was taken. Curve fitting and the statistical evaluation was preformed using Prizm GraphPad. All contractile responses were calculated in ‘g'. Each point represents the mean±s.e.mean (n=9 in each group). (B) Analysis of the frequency in tone oscillation in response to 1 μM PE in aortae from L2 (n=9) and L2LPL (n=9) mice. Each point represents the mean±s.e.mean. *P<0.05 vs oscillations in tone obtained in aortae from the L2 animals.