
Figure 2.
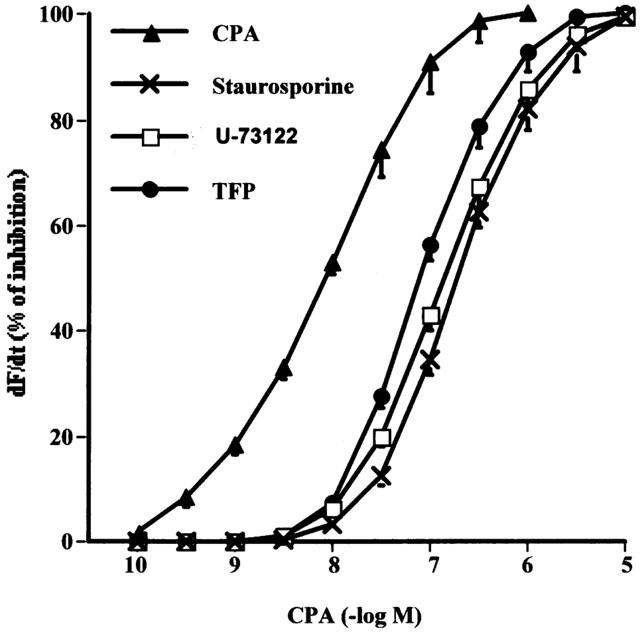
Effect of 5×10⁻⁶ M of U-73122, 5×10⁻⁶ M TFP and 1×10⁻⁹ M staurosporine on the dose-response curve of CPA upon atria dF/dt. Tissues were incubated for 30 min in presence or absence of different inhibitors and then the dose-response curves to CPA were obtained. Values represent the mean±s.e.mean seven experiments in each group. For more details see Figure 1.