
Figure 2.
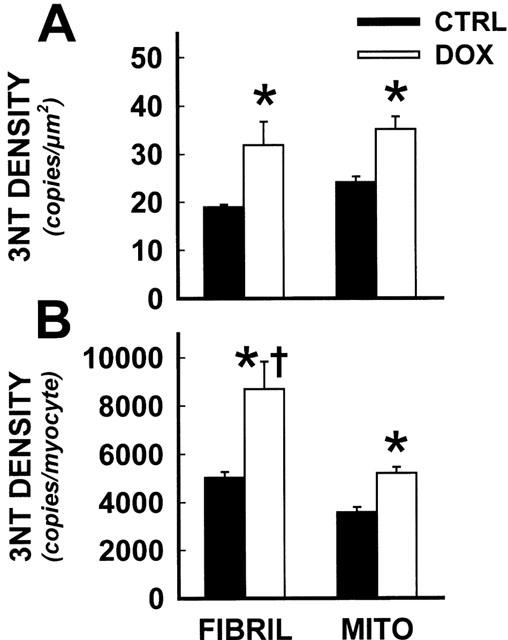
Quantitative image analysis demonstrated high 3NT density in cardiac myofibrils during DOX cardiotoxicity. Quantitative image analysis was conducted on immunogold electron micrographs from CTRL and DOX treated mice. Following area calibrations, myofibrillar and mitochondrial gold particle density was expressed as a function of area (A) and total myocyte area (B). *Statistically significant difference from CTRL, P<0.05; †, DOX myofibrillar 3NT density significantly different from DOX mitochondrial staining, P<0.05.