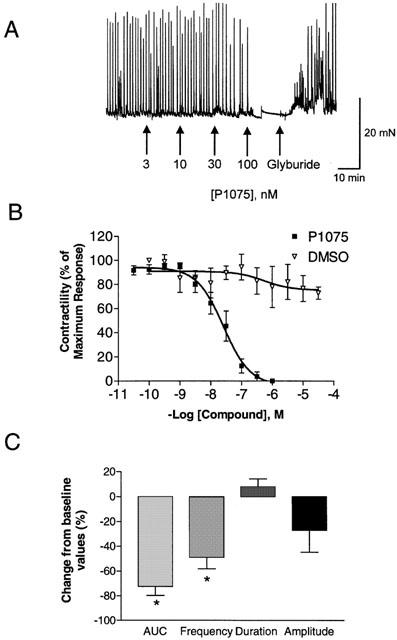
Figure 7.

The inhibition of spontaneous phasic activity of the pig bladder by KATP channel openers. (A) Concentration response curve for the KATP channel opener, P1075 and its reversal by glyburide. Shown is a representative tracing. (B) Mean concentration response curves for P1075 (n=8) and DMSO (n=8). Data were analysed as a percentage of maximum response. (C) The overall inhibition caused by P1075 (30 nM) expressed as a percentage change from baseline was due to a reduction in frequency with no substantial change in duration or amplitude. *Represents significant differences from baseline responses (P<0.05; n=4).
