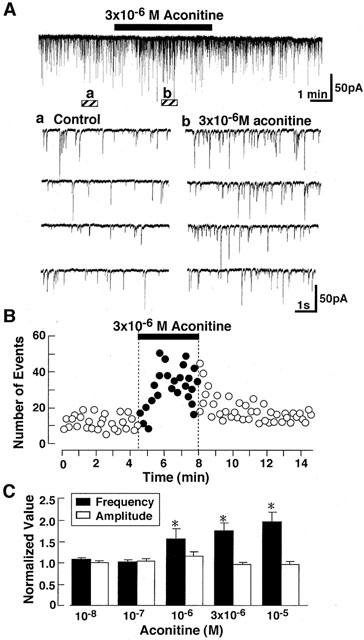
Figure 2.

Effect of aconitine on spontaneous IPSCs. (A) Representative current traces in the absence and presence of aconitine. Current recordings were performed with patch-pipette solution containing 80 mM Cl−. Holding potential (VH) was -80 mV. Lower panel shows the four consecutive current traces at expanded time scale at the symbols. (a,b) indicating in the upper panel. (B) Effects of 3×10⁻⁶ M aconitine on spontaneous IPSCs. Aconitine was applied during a period shown by horizontal bar. Number of events in every 10 s was plotted. (C) Summary of the effect of various concentration of aconitine on the mean amplitude (white) and frequency (black) of spontaneous IPSCs. Each column is average of six neurons.
