
Figure 1.
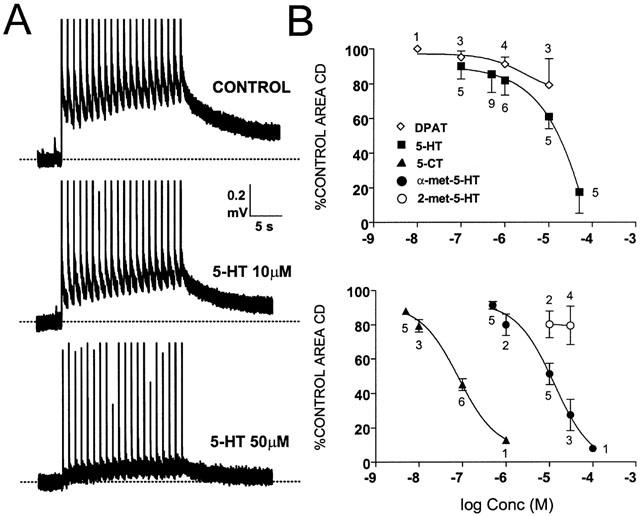
Effects of 5-HT. (A) Shows original recordings obtained from the same experiment. Responses to trains of stimuli produced a cumulative depolarization (CD) which was reduced by 5-HT although a certain slope is still visible during superfusion of 5-HT 50 μM. The large vertical lines correspond to stimulus artefacts in this and subsequent figures. The graphs in (B) show the concentration-response curves for 5-HT and 8-OH-DPAT (upper graph) and for 5-CT, α-met-5-HT and 2-met-5-HT (lower trace) on the integrated area of the CD. The numbers over the data points indicate number of observations.