
Figure 4.
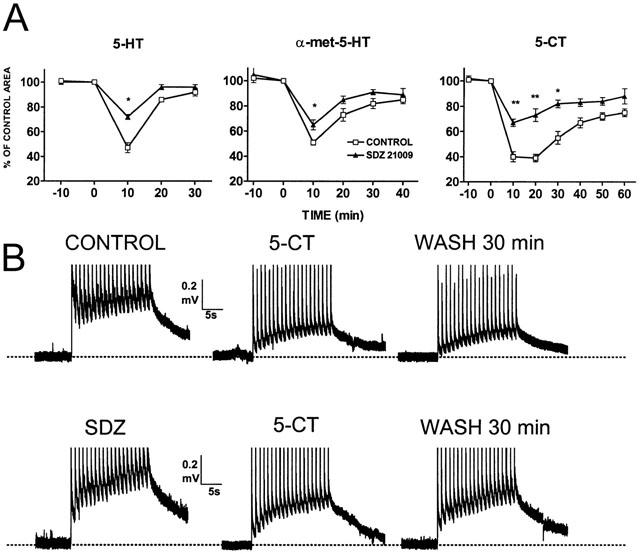
Effects of SDZ 21009. Each graph in (A) shows a comparison between control responses to 5-HT (10 μM), α-met-5-HT (10 μM) and 5-CT (0.1 μM) (hollow squares, n=6 – 8) and responses in the presence of SDZ-21009 100 nM (filled triangles; n=6 – 8). Test stimulus were given at 10 min intervals. The peak effect of the agonist was significantly smaller (* for P⩽0.5; ** for P⩽0.01). (B) shows original recordings obtained from two different preparations (upper and lower traces). The upper traces show the effect of 5-CT during application of the drug and after 30 min of wash in control ACSF. The lower traces show the same sequence in SDZ-21009 containing ACSF.