
Figure 1.
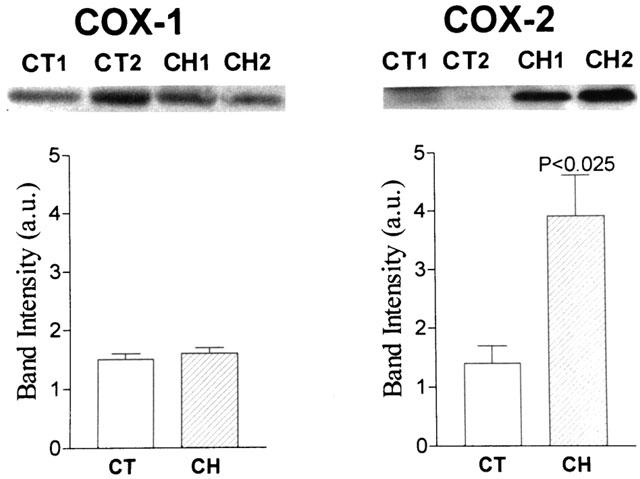
Renal COX-1 and COX-2 protein levels. Upper panels: representative Western blot analysis of COX-1 (Mr, 70 kDa) and COX-2 (Mr, 72 kDa) in renal tissue samples from two control rats (CT1 and CT2) and two cirrhotic rats with ascites (CH1 and CH2). Renal protein extracts were electrophoresed and probed with specific anti-COX-1 and anti-COX-2 antibodies. Lower panels: COX-1 and COX-2 band intensities were determined by scanning densitometry. Results show the mean±s.e.m. of six cirrhotic and seven control rats.