
Figure 6.
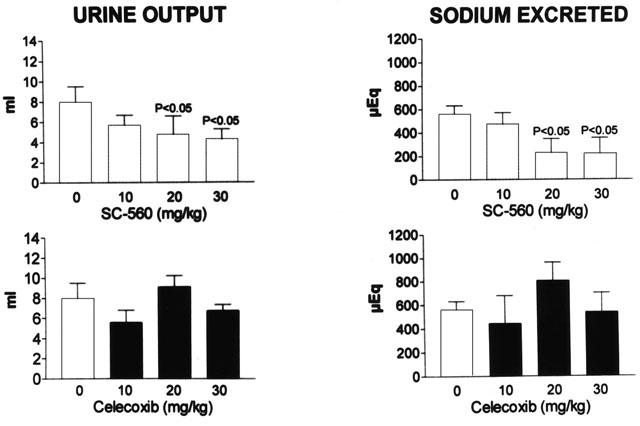
Diuretic and natriuretic responses to furosemide in rats with cirrhosis and ascites treated with increasing doses of selective COX inhibitors. Graph bars show the overall urine output and the cumulative sodium excretion over the 80 min after the administration of furosemide (5 mg kg−1) to different groups of rats treated with placebo (0 mg kg−1), SC-560 (10, 20 or 30 mg kg−1) or celecoxib (10, 20 or 30 mg kg−1). Results are given as mean±s.e.m. Data are compared by the Student's t-test for unpaired data and P values denote statistically significant differences with respect to the placebo-treated group.