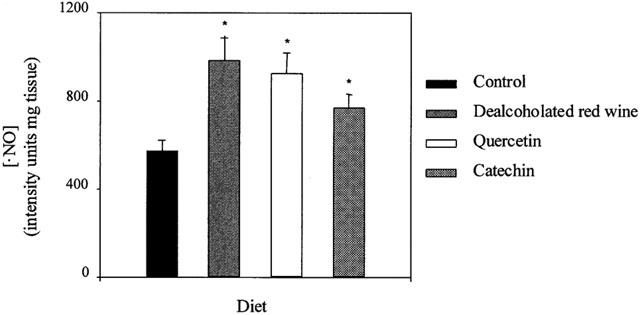
Figure 4.

•NO production in intact aortic segments from rats fed a control, dealcoholated red wine-, quercetin- or catechin-rich diets. Values are the mean±s.e.mean of five rats.*P<0.01 significantly different compared with control, by the Student's unpaired t-test, the s.e.mean is shown by vertical lines.
