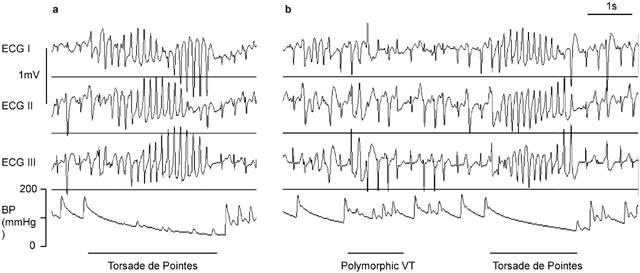
Figure 2.

Examples of arrhythmias in an anaesthetized rabbit which was receiving phenylephrine and clofilium. The traces shown are Leads I, II and III of the limb lead ECG and the arterial blood pressure (BP). Panel (a) is from the 2nd cycle of drug administration and shows a short episode of torsade de pointes, where the twisting of the QRS complexes around the isoelectric line can be seen clearly. In panel (b) which is from the 3rd dosing cycle, there is a short episode of polymorphic VT that is not torsade de pointes and shortly after there is another episode of torsade de pointes. Note that during the polymorphic VT the blood pressure signal remains pulsatile whereas during the episodes of torsade de pointes there is little pulsatile activity and the blood pressure is declining towards zero.
