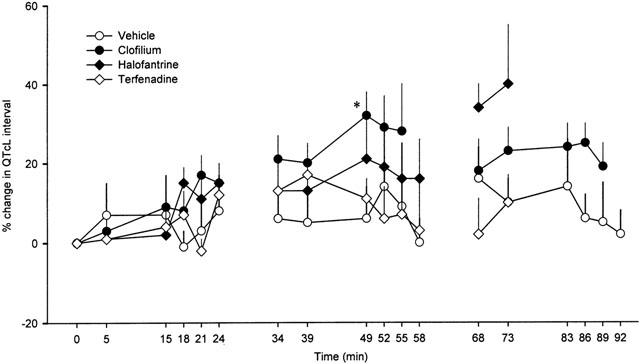
Figure 8.

Per cent change in the QT interval corrected for heart rate using the Liverpool formula (QTcL) in anaesthetized rabbits during each of the three consecutive dosing cycles. Values are means with vertical bars indicating s.e.mean. Group n values are vehicle=5, clofilium=8, terfenadine=7 and halofantrine=6. At some time points n is less than the total for the group because marked arrhythmic activity prevented accurate measurement of ECG intervals. Where data are missing n<3 due to arrhythmias or in the case of terfenadine, contractile failure. *P<0.05 compared to vehicle control group, Kruskal-Wallis test.
