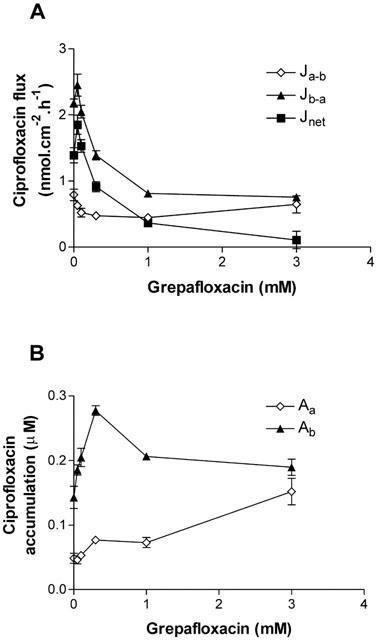
Figure 3.

Concentration-dependent grepafloxacin inhibition of ciprofloxacin secretion across Caco-2 monolayers. (A) Transepithelial ciprofloxacin (100 μM) fluxes measured alone and in the presence of increasing concentrations of grepafloxacin in both the apical and basolateral compartments. Jnet shown as Jb-a – Ja-b. n=8 – 9 epithelia (uptakes) or paired epithelia (fluxes) per data point. (B) Cellular ciprofloxacin from apical or basal bathing solutions in the presence of increasing grepafloxacin concentrations. Other details as above.
