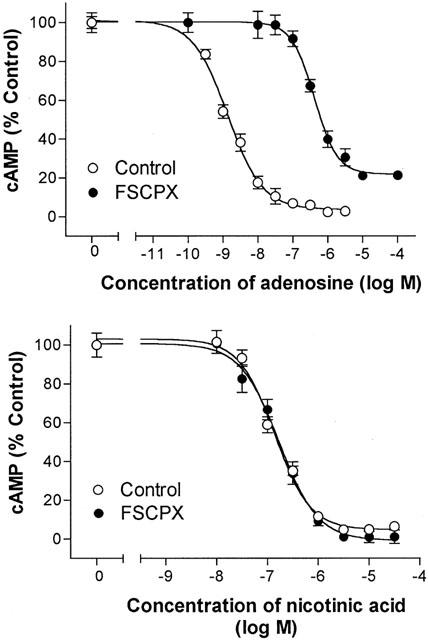
Figure 2.

Concentration – response relationships for adenosine (top panel) and nicotinic acid (bottom panel) to decrease cyclic AMP content of control and FSCPX (10 μM)-treated rat adipocytes in the presence of 30 nM isoproterenol. Symbols indicate mean and s.e. of mean values of six repeats from each of 4 – 8 experiments. Data were fit as described in Methods to derive a value of KA for each A1AdoR agonist.
