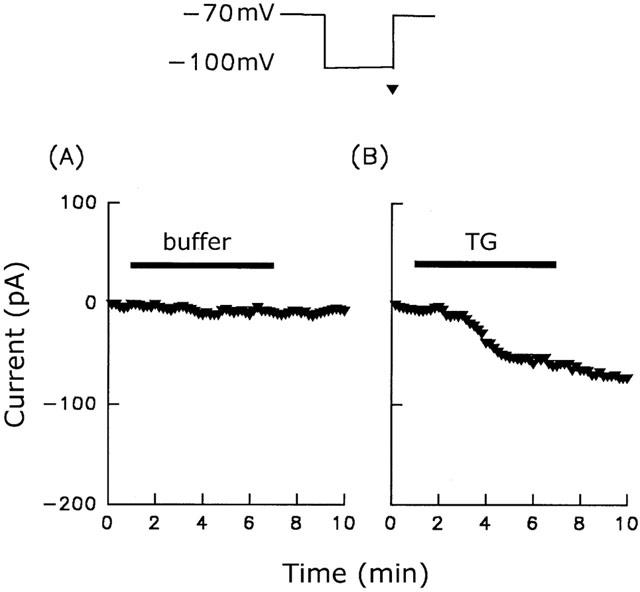
Figure 7.

ISOC activation by thapsigargin. The current was measured by step-pulse recording from a holding potential of −70 mV to a test potential of −100 mV over a period of 100 ms executed every 10 s. From these pulses, the amplitudes of the currents measured at −100 mV (indicated by the triangle) before, and after, perfusion with, and after washout of, buffer (A) or 1 μM thapsigargin (B) were plotted versus time. The perfusion period is indicated by the horizontal bars. Similar results were seen using six different batches of cells (n=10).
