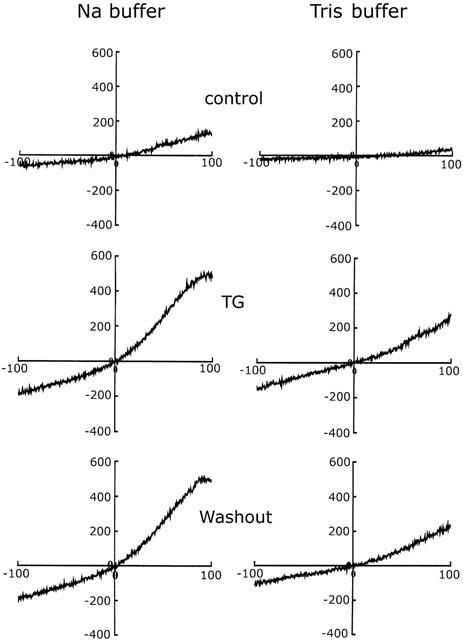
Figure 8.

Membrane currents in response to extracellular application of thapsigargin. The holding potential was −40 mV and ramp pulses were given every 5 s from −100 mV to 100 mV at a speed of 2 V/s. I-V curves for control cells (top traces), cells showing the maximal response to thapsigargin (middle traces), and cells after thapsigargin washout (bottom traces) in Na+-containing (left traces) and Na+-free (right traces) bathing buffer are shown. Similar results were seen using six different batches of cells (n=10).
