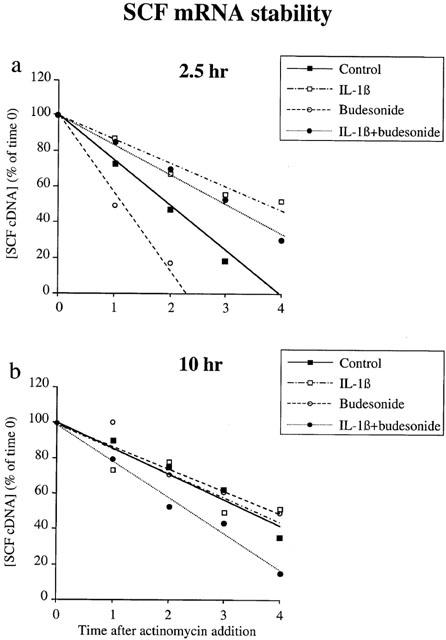
Figure 2.

SCF mRNA stability. Fibroblasts were treated with IL-1β (400 pg ml−1), budesonide (0.1 μM), IL-1β plus budesonide or ethanol (1 μM; control) for 2.5 h (a) or 10 h (b) Fibroblasts were then washed and treated with 5 μg ml−1 actinomycin D for the indicated time. SCF cDNA was quantified by on-line fluorescent PCR. Results are expressed as a percentage of the quantity of SCF cDNA measured for each treatment at time 0 of actinomycin D addition, which is represented as the 100% of each treatment. Data are means of three experiments performed in duplicate on fibroblasts from three different donors.
