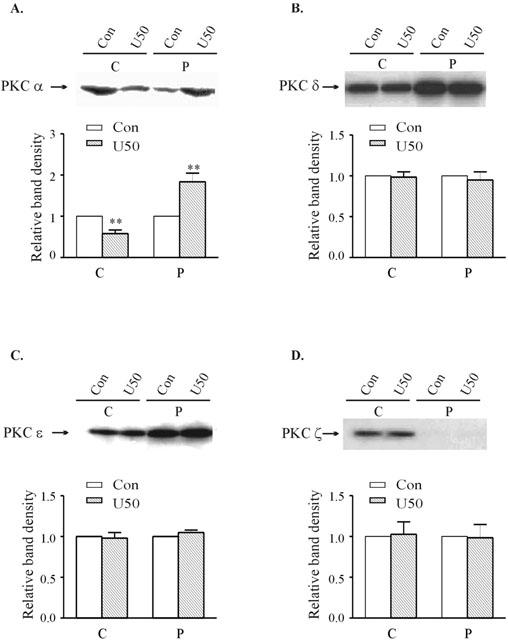
Figure 4.

Effects of 10 min treatment with 30 μM U50,488H on the subcellular distribution of PKC-α (A), -δ (B), -ε (C) and -ζ (D) in naïve ventricular myocytes. Upper panel: Representative Western blots. Lanes 1 and 2 represent, respectively, cytosolic fractions isolated from untreated and U50,488H-treated cells; Lanes 3 and 4 represent, respectively, particulate fractions isolated from untreated and U50,488H-treated cells. Lower panel: Group results showing expression of different isoenzymes as assessed by densitometric analysis. Data are expressed as percentage changes in the density of autoradiographic bands of cytosolic (C) or particulate (P) fractions from U50,488H-treated ventricular myocytes (hatched bars) relative to those from untreated cells (white bars, 100%). The data are expressed as mean±s.e.mean. (n=5). **P<0.01, vs corresponding control value.
