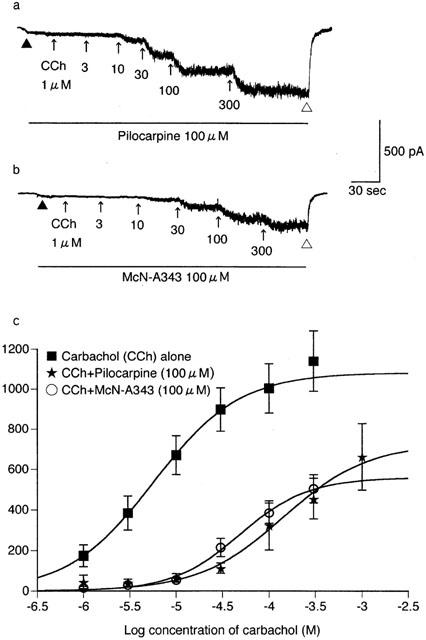
Figure 5.

The effect of pilocarpine and McN-A343 on the carbachol concentration-effect curve for Icat activation. The current response to carbachol was recorded as described in Figure 1, except for the presence of 100 μM pilocarpine (a) or McN-A343 (b) in the bath solution as indicated by the lines. (c) The averaged curves for carbachol in the presence of pilcarpine or McN-A343 and the control curve repeated from Figure 4a. Each point for the former two curves indicates the mean±s.e.mean of measurements in five cells.
