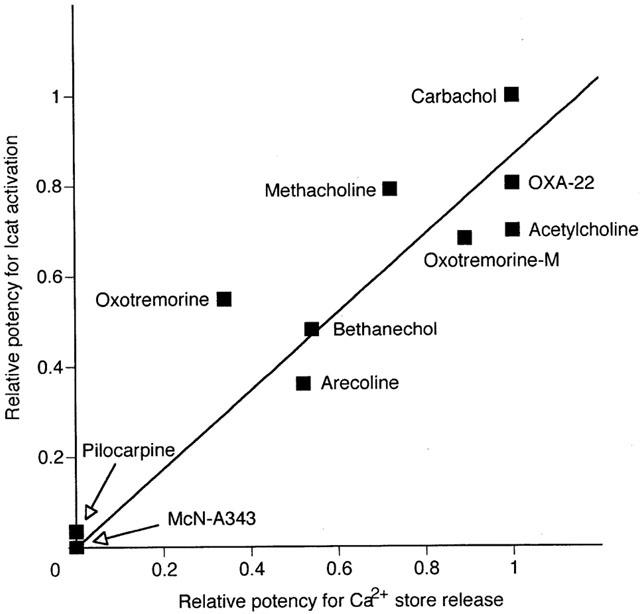
Figure 9.

Correlation between muscarinic agonist poptency for Icat activation and for Ca2+ store release. The former potency was defined by the Imax values in Table 1 and the latter, by the proportional size of agonist-evoked IK-Ca to the sum of this and subsequent caffeine current in Table 2 (see column Sum/Agonist), and these respective potencies were normalized by the value for carbachol and plotted for Ca2+ store release on the X axis and for Icat activation on the Y axis. The solid line indicates a regression line calculated using the data points from the 10 agonists, as expressed by Y=0.865X. The obtained Pearson's correlation-coefficient of 0.923 was greater than the expected value for a significant correlation (0.872, when n=10 and P<0.001).
