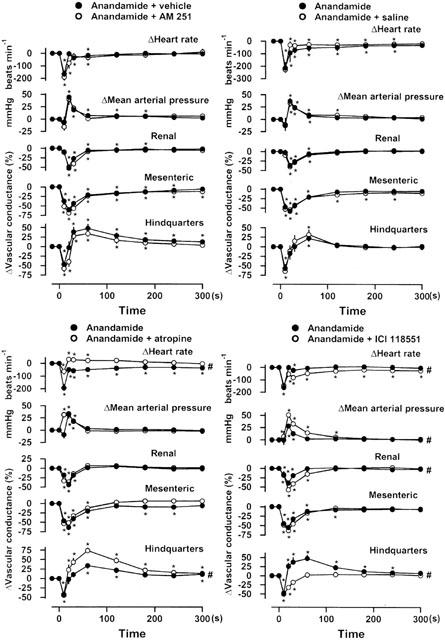
Figure 3.

Cardiovascular responses to anandamide (3 mg kg−1) in the presence of vehicle or AM 251 (n=7), or to anandamide alone, or in the presence of saline (n=6), or in the presence of atropine (n=9), or in the presence of ICI 118551 (n=11). Values are mean and vertical bars show s.e.mean; *P<0.05 versus baseline (Friedman's test); #P<0.05 for integrated areas in the two conditions (Wilcoxon's test).
