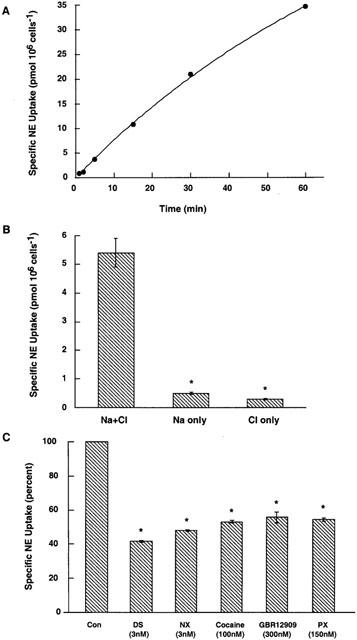
Figure 2.

NE uptake in trophoblasts is NET mediated. (A) Time-dependent uptake: Uptake of 50 nM [3H]-NE in the presence or absence of 1 μM DS was measured at different time periods for 60 min. Specific NE uptake was measured by subtracting NE uptake measured in the presence of 1 μM DS from NE uptake measured in the absence of DS. Data are represented in pmol (106 cells)−1. Specific NE uptake plotted against time showed a monotonic relationship. The data represent the mean±s.e.m. from two experiments carried out in triplicate using different trophoblast cultures. (B) Ion-dependent uptake: NE uptake, given as pmol (106 cells)−1 10 min was measured in the presence of Na and Cl ions, or in the presence of Na only or Cl only as described in panel A. Transport of NE by trophoblasts requires both Na and Cl ions. The data represent the mean±s.e.m. from two different experiments carried out in triplicate on different trophoblast cultures. Asterisks denote significant difference of DS-sensitive NE uptake in the absence of Na and Cl ions as compared to DS-sensitive NE uptake in the presence of both the ions, P<0.05 (Student's t-test and ANOVA). (C) Inhibitor sensitivity of NE uptake: Inhibitor potencies were estimated in uptake assays performed using 50 nM of [3H]-NE with indicated concentrations of inhibitors for monoamine transporters. We chose concentrations of inhibitors near their IC50 values reported previously for NET. Data are expressed as percentage of NE accumulated in the absence of inhibitors. The data represent the mean±s.e.m. from two different experiments carried out in triplicate using different trophoblast cultures. Asterisks denote significant difference of DS-sensitive NE uptake in the presence of inhibitors as compared to control NE uptake in their absence, P<0.05 (Student's t-test and ANOVA).
