
Figure 3.
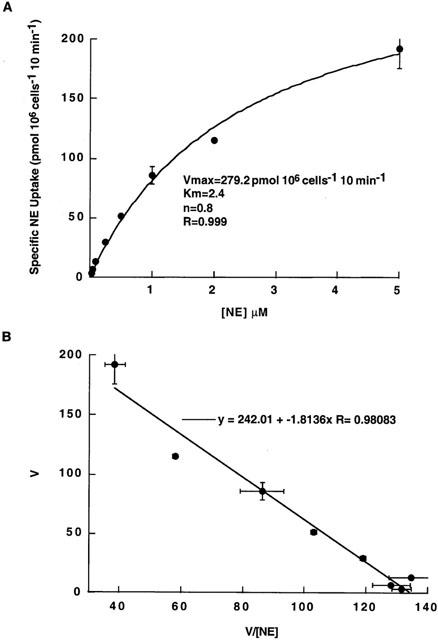
NE uptake kinetics in trophoblasts. (A) Concentration-dependent uptake: NE uptake was measured from 0.05 to 5 μM during 10 min incubation in KRH buffer at 37°C. We kept the concentration of radiolabelled NE constant at 50 nM and adjusted the total concentration by adding unlabelled NE. Specific NE uptake was calculated by subtracting NE uptake measured in the presence of 1 μM DS from NE uptake measured in the absence of DS. NE transport in trophoblasts is saturable with a Km=2.4±0.3 μM and Vmax=279.20±18.11 pmol (106 cells)−1 10 min. The R value (0.999) shows the goodness-of fit. We obtained a Hill coefficient of 0.803 when data were fit to either a single-site or a two-site model. (B) Eadie – Hofstee plot: The data from panel A are plotted as NE uptake velocity (V) versus V/[NE]. The Eadie – Hofstee plot was linear and the R value (0.980) shows the goodness-of fit. The data represent the mean±s.e.m. from two experiments carried out in triplicate using different trophoblast cultures.