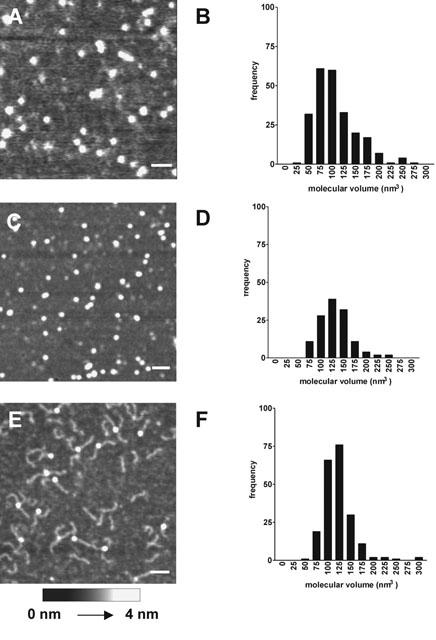
Figure 2.

Effect of biotinylation on the structure of streptavidin. (A) Scan of unoccupied streptavidin (5 nM) imaged by tapping-mode AFM in air. (B) Distribution of calculated molecular volumes of unoccupied streptavidin. Volumes were placed in 25-nm3 bins. (C) Scan of streptavidin complexed with biotin. Streptavidin (5 nM) was incubated with biotin (10 nM) for 1 h at 22°C before adsorption to mica. (D) Distribution of calculated molecular volumes of biotinylated streptavidin. (E) Scan of streptavidin complexed with DNA-biotin. Streptavidin (5 nM) was incubated with DNA-biotin (50 nM) for 1 h at 22°C before adsorption to mica. (F) Distribution of calculated molecular volumes of streptavidin complexed with DNA-biotin. Scale bars: 50 nm. A shade-height scale is shown at the bottom.
