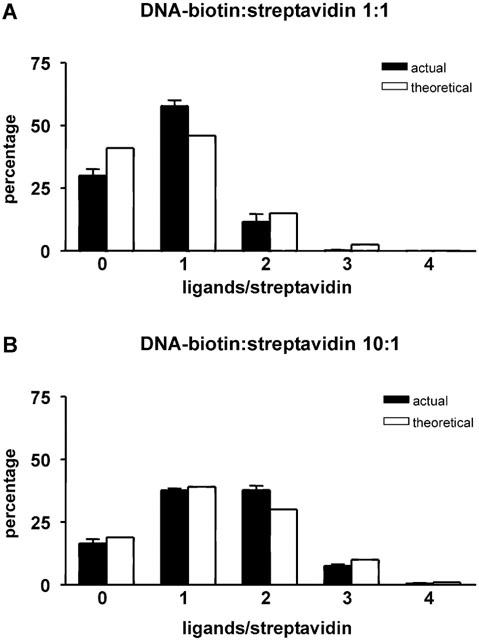
Figure 5.

Frequencies of the various forms of DNA-biotin liganding at DNA-biotin : streptavidin molar ratios of 1 : 1 (A) and 10 : 1 (B), compared with theoretical values. The concentration of streptavidin was 5 nM in each case. The histograms show the actual (filled bars) and theoretical (open bars) percentages of the various occupation states of streptavidin. Eight (A) or five (B) separate samples, containing a total of 1335 (A) or 1970 (B) streptavidin particles, were analysed. Errors refer to the variation between samples. The overall occupancies of the binding sites were 20±0.02% (A) and 34±0.01% (B).
