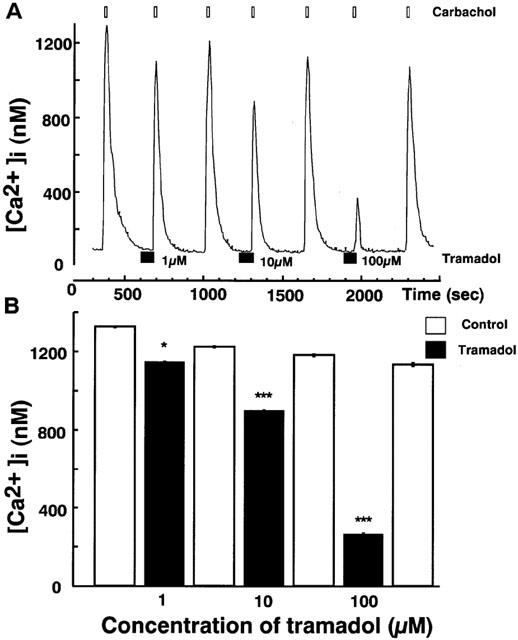
Figure 3.

Effects of tramadol on [Ca2+]i rises induced by carbachol in bovine adrenal chromaffin cells. These figures show average changes of the cytosolic Ca2+ concentration induced by carbachol (300 μM) with or without various concentrations of tramadol (1,10 and 100 μM) (A and B). Carbachol was added for 20 s after pretreatment with tramadol (10 μM). Tramadol alone did not induce any change in basal [Ca2+]i rises. Open bars mean the period for carbachol applications and closed bars indicate the period for tramadol applications. *P<0.05, ***P<0.001 (n=16).
