
Figure 1.
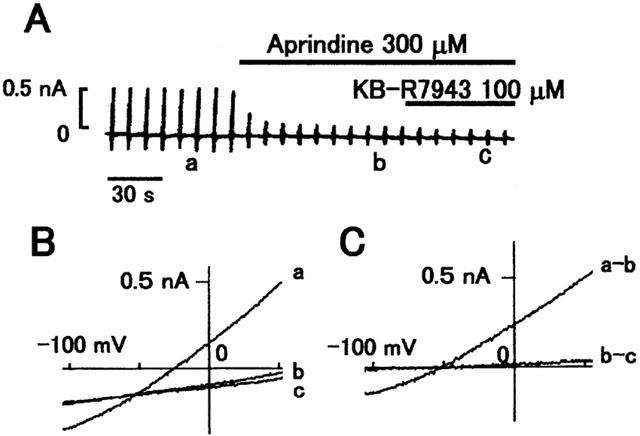
Effect of 300 μM aprindine on INCX. (A) Typical chart recording of membrane current. The bars above the current indicate when 300 μM aprindine and 100 μM KB-R7943 were applied externally. (B) I – V curves obtained at the time points corresponding to the labels in (A). (a) is the control and (b) in the presence of aprindine and (c) in the presence of KB-R7943. (C) Difference I – V curves between a and b (a-b) and between b and c (b-c) in (B).