
Figure 2.
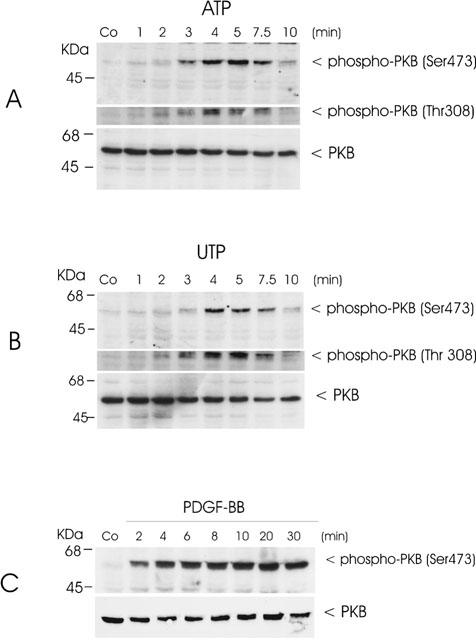
Time-course of ATP- and UTP-stimulated PKB phosphorylation in mesangial cells. Quiescent mesangial cells were treated with either vehicle (co), 100 μM of ATP (A), 100 μM of UTP (B) or 25 ng ml−1 of PDGF-BB (C) for the indicated time periods. Thereafter cells were harvested and Western blot analyses were performed using specific phospho-Ser473-PKB (upper panel), phospho-Thr308-PKB (middle panel) and total PKBα (lower panel) antibodies at a dilution of 1 : 1000, 1 : 1000 and 1 : 1600, respectively. Bands were detected by the ECL method according to the manufacturer's recommendation. Data are representative of 2 (C) or 3 (A and B) independent experiments giving similar results.