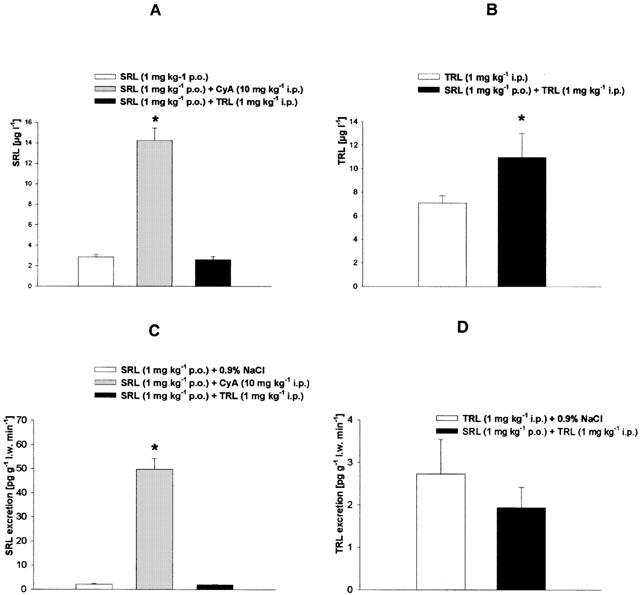
Figure 4.

Blood concentrations and biliary excretion of (A,C) sirolimus and (B,D) tacrolimus after daily treatment over 2 weeks with sirolimus (SRL, 1 mg kg−1 p.o.), tacrolimus (TRL 1 mg kg−1 i.p.) and of SRL (1 mg kg−1 p.o.) plus CyA (10 mg kg−1 i.p.) or TRL (1 mg kg−1 i.p.). Means±s.e.mean of 10 animals each. *Significant difference (P<0.05) compared to the SRL- or TRL-treated group. (l.w., liver weight).
