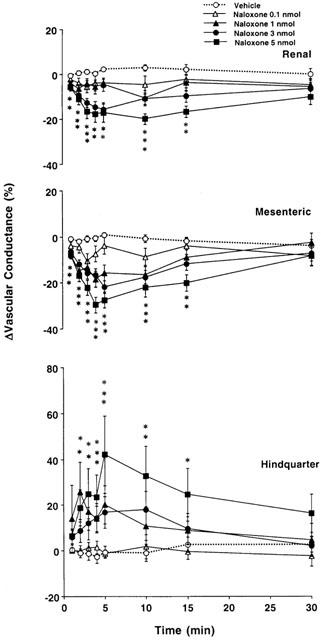
Figure 3.

Changes in regional vascular conductances elicited by bilateral microinjection of the vehicle (aCSF, n=12) or increasing doses of naloxone – methiodide (0.1 – 5 nmol, n=12) into the PVN of conscious, unrestrained rats. These data were derived from the data shown in Figure 2. Values are means±s.e.mean shown by vertical lines. A significant interaction between treatment and time was found for all calculated cardiovascular variables. *P<0.05 when the cardiovascular responses to naloxone – methiodide at the dose of 1, 3 or 5 nmol are compared with those elicited by the control injection of aCSF.
