
Figure 2.
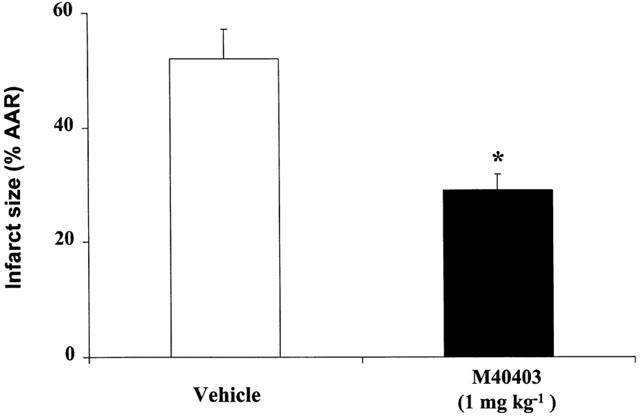
Graph of infarct size expressed as per cent of area at risk (AAR) after 30 min of ischaemia and 60 min of reperfusion. Each group is the mean±s.e.m. of at least nine experiments. Legend for each bar is shown underneath. *P<0.001.
Official websites use .gov
A
.gov website belongs to an official
government organization in the United States.
Secure .gov websites use HTTPS
A lock (
) or https:// means you've safely
connected to the .gov website. Share sensitive
information only on official, secure websites.
Graph of infarct size expressed as per cent of area at risk (AAR) after 30 min of ischaemia and 60 min of reperfusion. Each group is the mean±s.e.m. of at least nine experiments. Legend for each bar is shown underneath. *P<0.001.