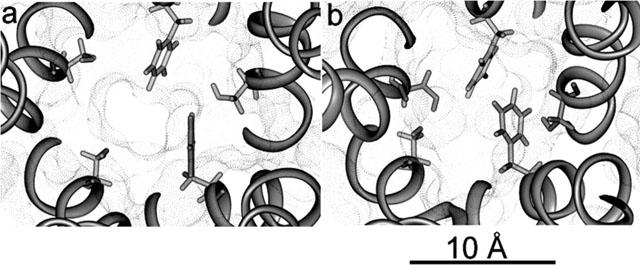
Figure 2.

Mutant ion channel sizes. Views of the mutant α4β2 ion channel in the minimized conformation (a) and in a transient closed conformation observed during a molecular dynamics simulation (b). Both are extracellular views perpendicular to the membrane plane, where all residues below the level of the mutant ring are not displayed to show the actual size of the pore. Black dots represent the solvent accessible surface within the ion-channel. Displayed side chains in stick representation are α4 Phe 248 and β2 Ser 271.
