
Figure 4.
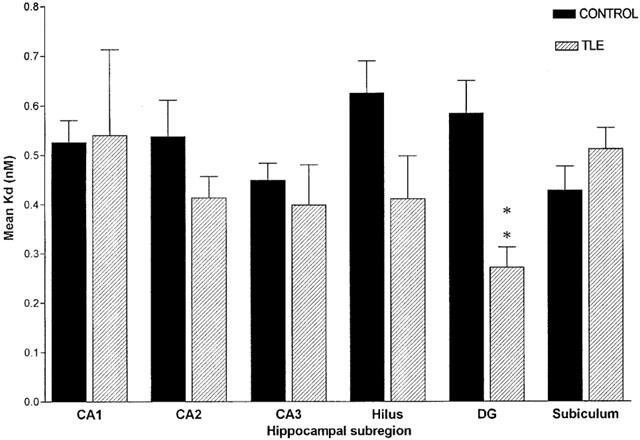
Mean receptor affinity (KD) in post mortem control hippocampal tissue (n=5–8) and resected epileptic hippocampal sample (n=8–13). Data are represented as mean±s.e.mean. Statistical analysis used unpaired Student's t-test (two-tailed), where **P<0.01. SUB, subiculum.