
Figure 6.
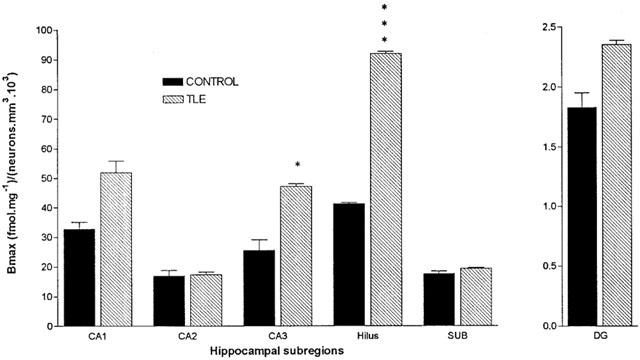
Histogram representing ratio of Bmax to neuronal density in tissue sections from post-mortem control and patients with HS. Histogram bars represent the mean ratio from hippocampal subregion and error bars represent s.e.mean. Groups were compared using an unpaired Student's t-test (two-tailed) where *P<0.05, ***P<0.001. SUB, subiculum.