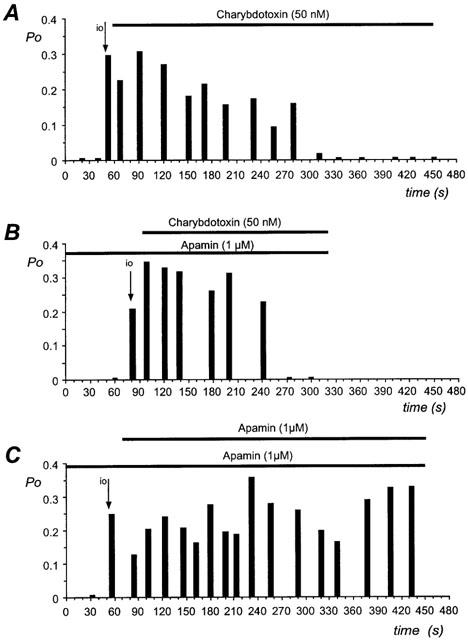
Figure 3.

Effect of toxins on open probability of SKap-ins channel. The open probability of the channel is plotted against the recording time during the application of the toxin at a holding potential of 0 mV. Each panel represents the recording obtained on a different cell. The horizontal bar indicates the presence of the toxin. (A) The perfusion of the patch pipette with charybdotoxin (50 nM), decreased the channel activity. (B) The pipette solution enriched with apamin (1 μM) is perfused with charybdotoxin (50 nM). (C) The pipette solution enriched with apamin (1 μM) is perfused with apamin (1 μM). The arrow indicated the transition between the cell-attached and the inside-out (io) configuration. Data are representative recordings from 2–4 experiments.
